Cluster analysis of Boston’s restaurants
Cluster analysis of Boston’s restaurants
First, I consider choosing DBSCAN to perform spatial cluster analysis on different restaurants. But the result was very poor, almost all restaurants are in a cluster, so I had to give up this attempt.
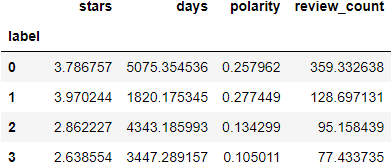
Here I performed a cluster analysis on the data obtained above. First, I selected the features ‘review_count’, ‘polarity’, ‘days’, ‘stars’, ‘dist_park’ for analysis. I first scaled them using StandardScaler and built the matrix. Then I used the kmeans.fit tool for clustering, and set n_clusters=4. In the end I got the list as shown below.
Then I visualized all the data as shown in the figure below. First, I put all of label back to point and plotted them on the map. But it does not look so clear.
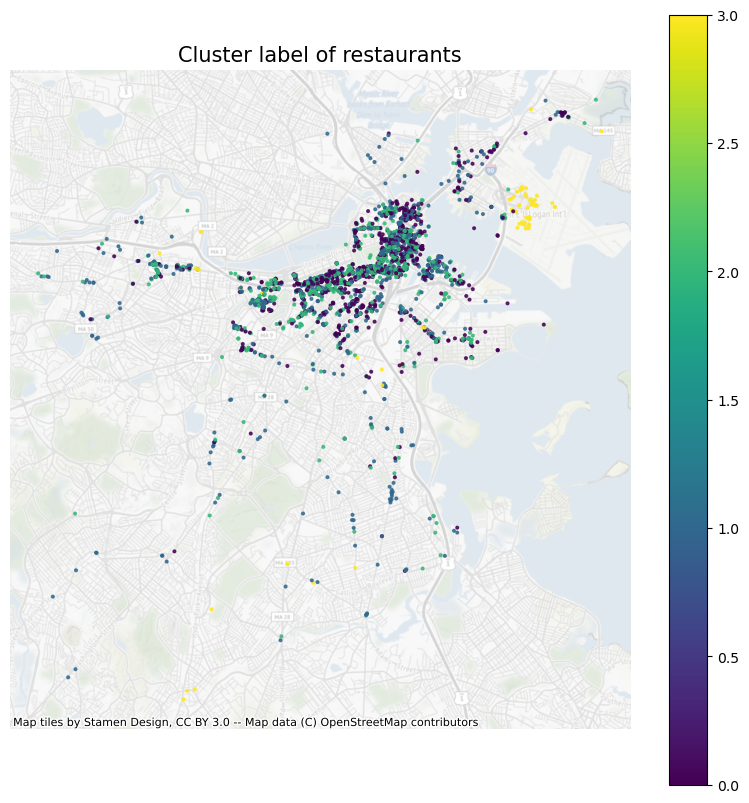
Thus, I make a chart by comparison to different variables.
In these clusters, 0 is some restaurants far away from the park, and they are also the ones with the lowest ratings. 1 is the mid-to-low rated restaurants clustered near the park, and they also have low review counts, probably some small establishments that are not doing well. 2 and 3 are high-scoring restaurants close to the park. 2 of them are old stores with long business hours and a lot of reviews. And 3 is like a boutique opened in recent years, which has also attracted many customers and good reviews.