Restaurant quality prediction based on yelp reviews and spatial location
What can we get from the Yelp reviews? I hope to use the previous analysis to establish a basis for how to choose or predict a high-scoring restaurant.
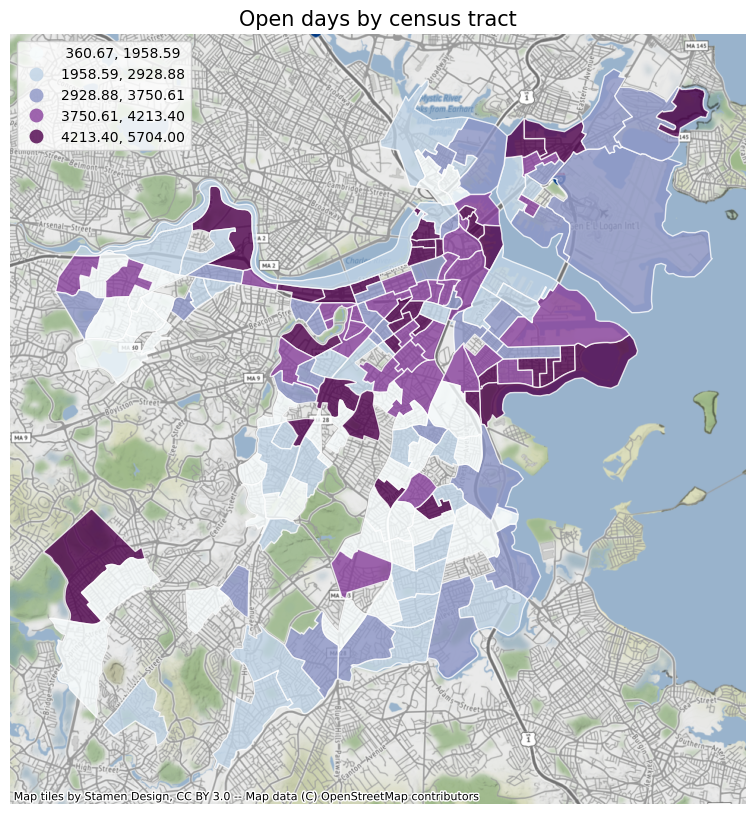
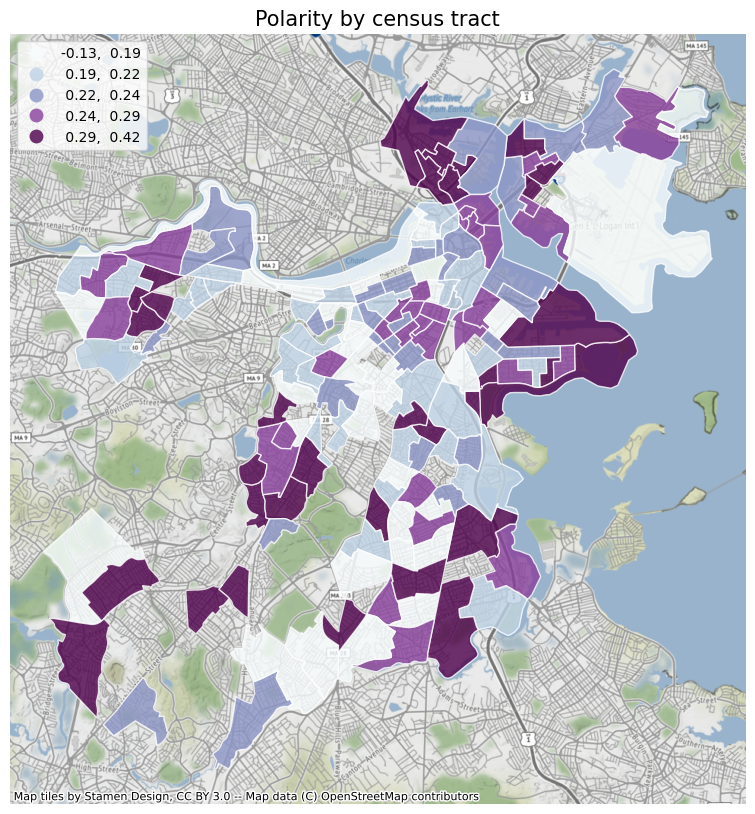
Plotting elements by census tract
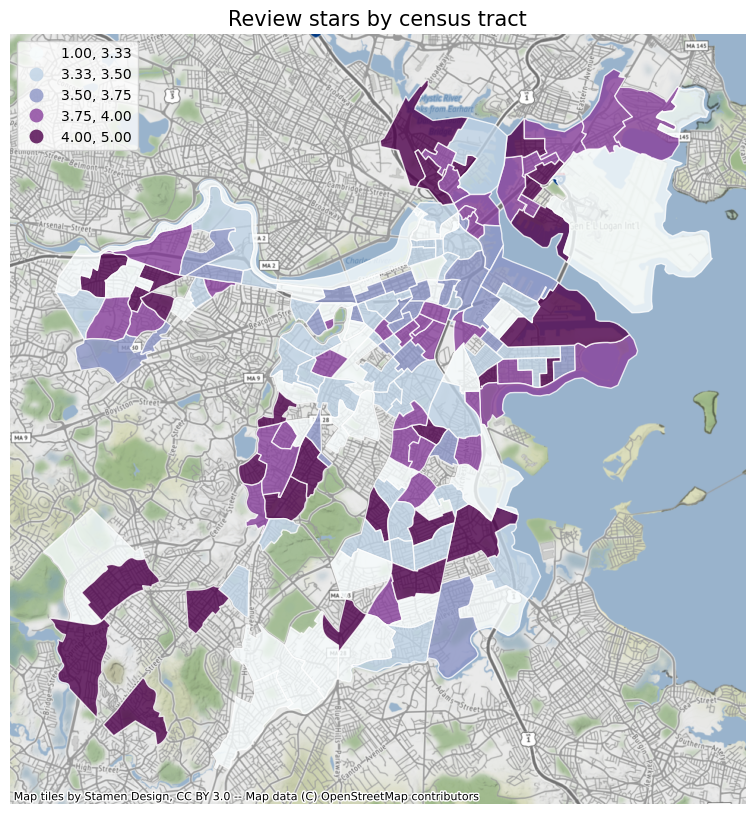
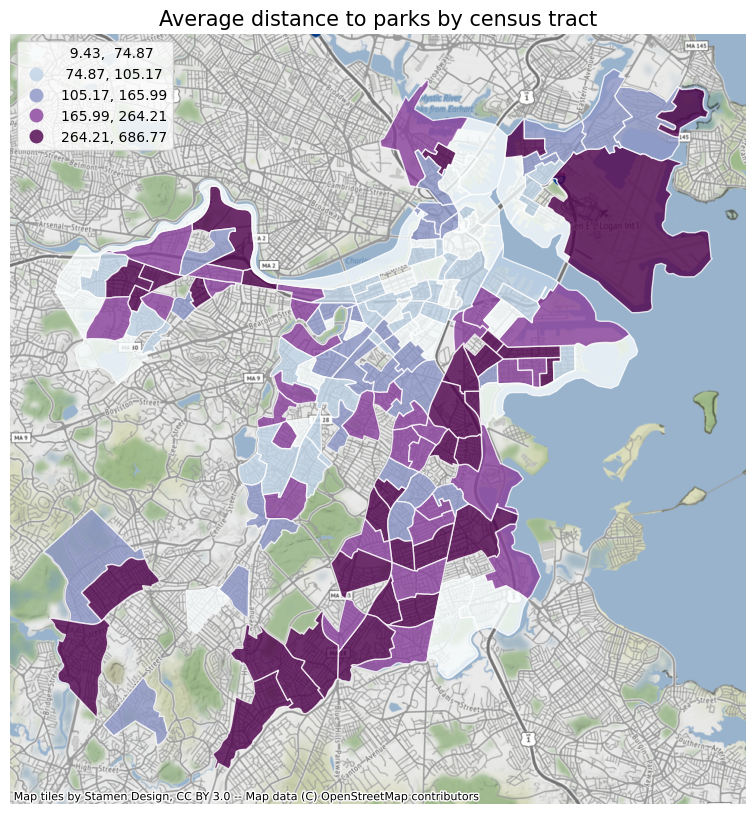
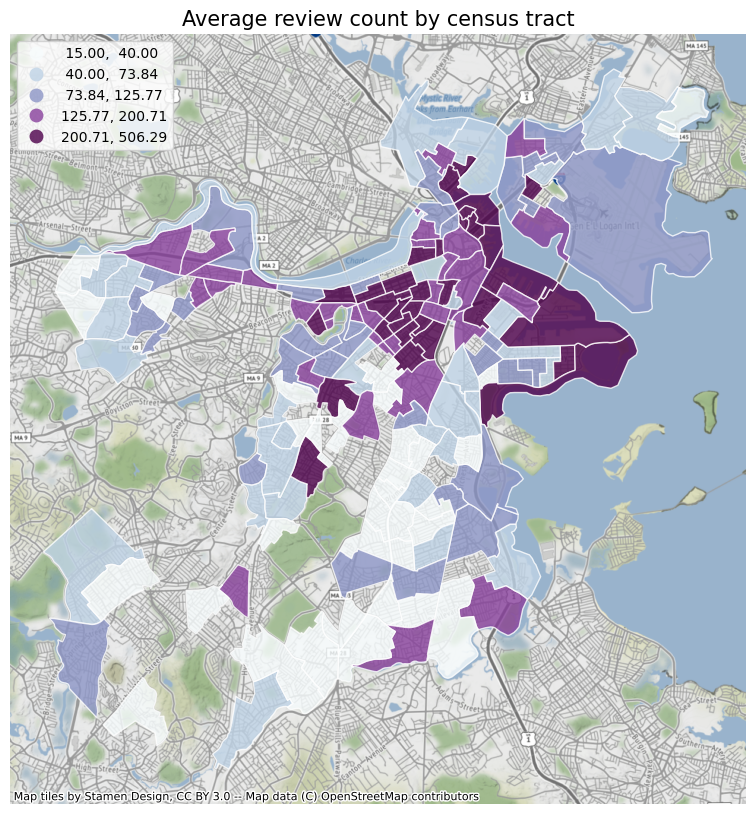
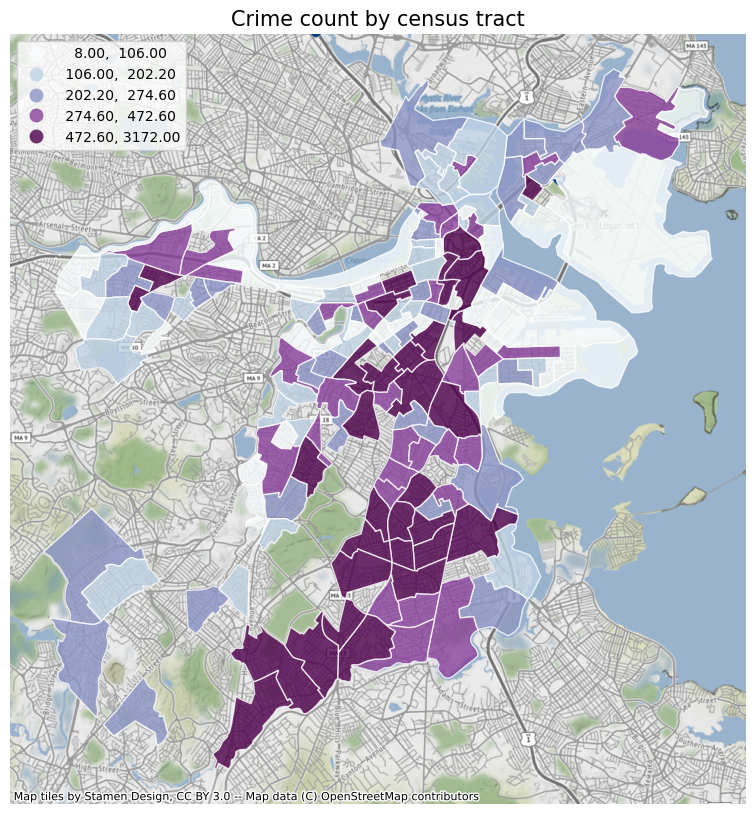
First of all, I will plot the various elements analyzed before according to the census tract, so as to obtain a general trend. And use the contextily package to add a basemap to the icon. At the same time, I also added the crime data of different census tracts in Boston for comparison. From the figure below, we can see that: review counts, polarity, stars, subjectivity, days since opening, the value of crime count is obviously related to the census tract. The crime rate near the city center and the Emerald Necklace is low, and the restaurants are close to the park. Most of the restaurants are old shops with high reviews. Restaurants in the north end of Boston have the highest average ratings, while South Boston has a lot of crime, restaurants far from parks and few reviews.
Run a baseline model of these elements
I divided all the data into two parts according to the thirty-seven points. Based on this, I use “review_count”, ‘dist_park’, ‘subjectivity’, ‘polarity’, ‘subjecvar’, ‘days’ as the training dataset. ‘stars’ is used as the test data set to establish a linear regression model as the baseline. This linear regression model has a test score of 0.68, which is beyond my expectations.
Run random forest model to predict restaurants
After this, I built another random forest model. I used “review_count”, ‘dist_park’, ‘polarity’, ‘subjectivity’, variance of stars, variance of ‘subjectivity’, ‘days’ as numerical features. I also used ‘GEOID’, and restaurant type as Categorical features. At the same time, I also got this heatmap and correlation table.
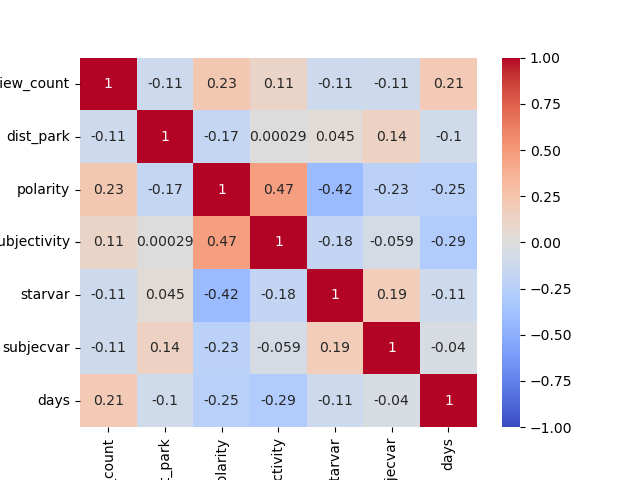
From the correlation table, it is obvious that polarity is the decisive factor. It domainate the model better than any other variables.
I set n_estimators = 42, and use GridSearchCV to perform a k-fold cross validation. The best fit for Random Forest is 0.775, which is even better than the baseline model.
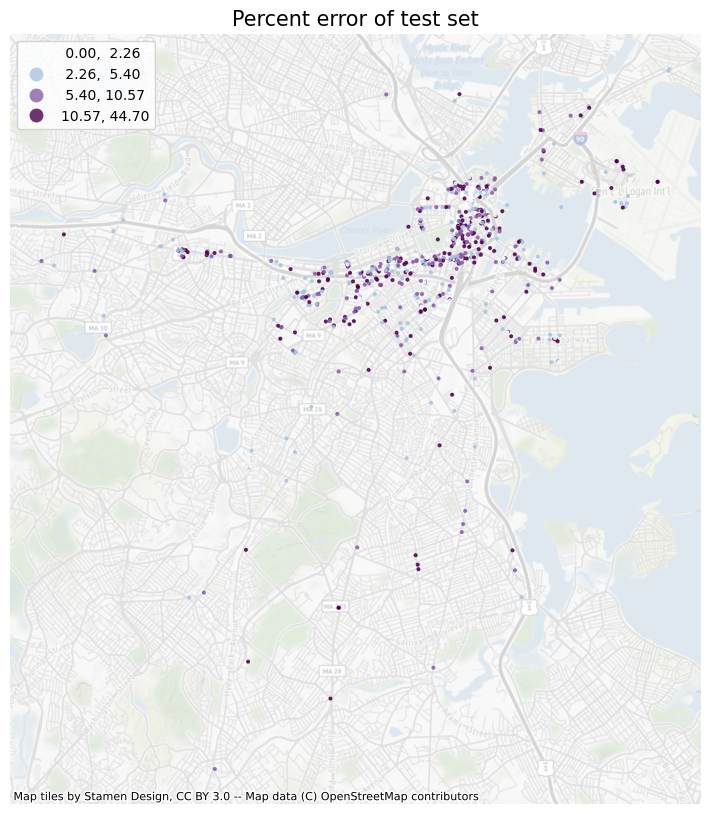
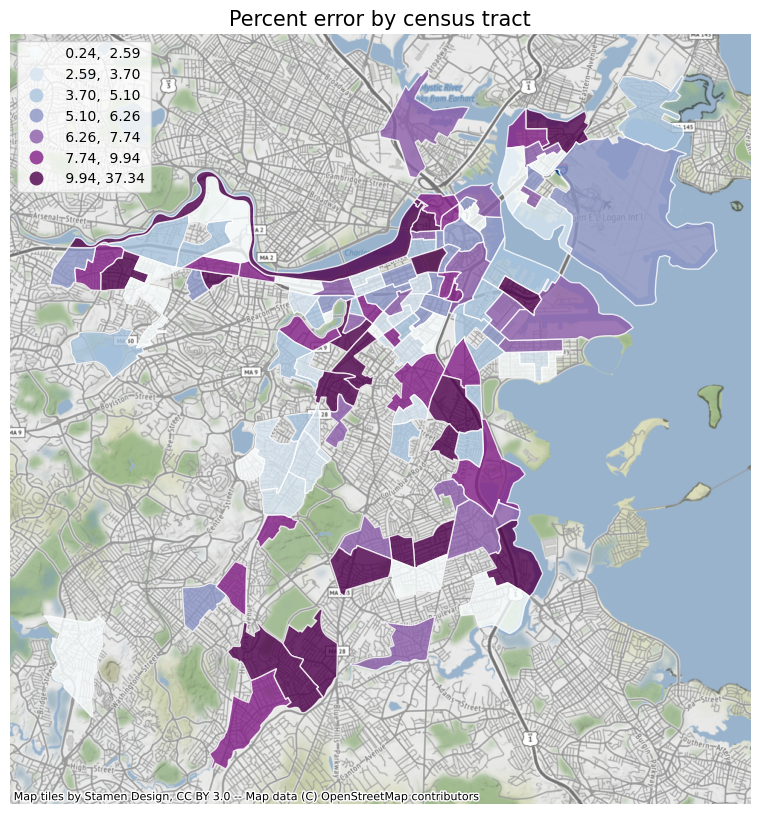
Analyze the percent error of test results
Finally, I calculated the percent error of the result, and it shows that the model predicts well in areas that are close to densely populated areas and filled with parks.
Discussion
The final result of this project deviates greatly from my vision, mainly in the uncorrelation of restaurant ratings with their spatial relationship. Regardless of the community crime rate, community location and distance from the park, the impact on the specific score of the restaurant is not particularly large. Perhaps this is also related to the nature of the restaurant. After all, as long as the food is delicious, it will be welcomed everywhere. In addition, the percent error of the model performs well in urban areas, but its main influencing factor is the past evaluation, which also brings certain limitations to this model. If YELP disclosed the average price of restaurants or more in the dataset, the model might be more accurate and convincing.